Vehicle Metrics
Overview
The Vehicle Metrics plugin is a paid feature of the OsmAnd app. Vehicle speed and Engine speed info is available for OsmAnd free.
The Vehicle Metrics plugin enables real-time vehicle data monitoring via the OBD-II protocol. Users can track essential metrics such as engine performance, fuel efficiency, and speed, allowing for proactive vehicle maintenance and troubleshooting.
OBD-II scanners are integral to modern automotive diagnostics. With real-time data streaming, users gain instantaneous insights into vehicle systems, facilitating preventive maintenance and reducing repair costs. These tools are vital for both personal use and professional automotive services.
- Android
- iOS
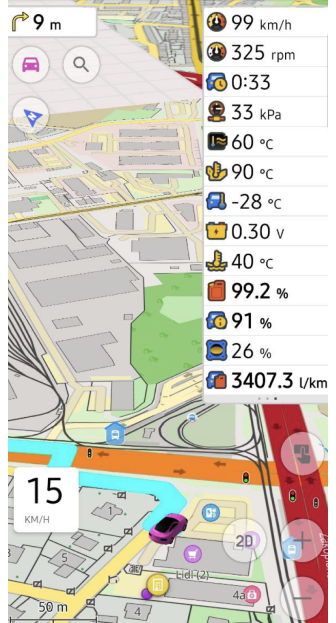
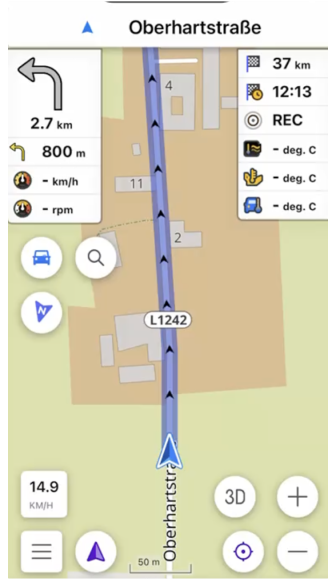
Required Setup Parameters
To use data from an OBD-II scanner:
- Purchase an OsmAnd Pro subscription. (Vehicle speed and Engine speed are free.)
- Enable the Vehicle Metrics plugin in the Plugins section of the Main Menu.
- Turn on Bluetooth on your device.
- Connect the OBD-II scanner to your vehicle's port.
- Configure the scanner settings.
- Add Vehicle Metrics widgets to for on-screen data (optional).
- Usethe Trip recording plugin to record vehicle data.
Pair ODB-II Scanner
- Android
- iOS
 |  |
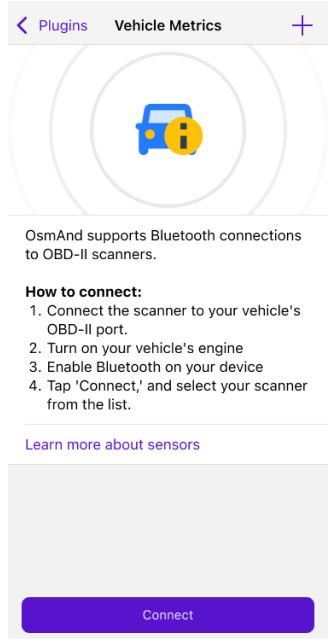 | 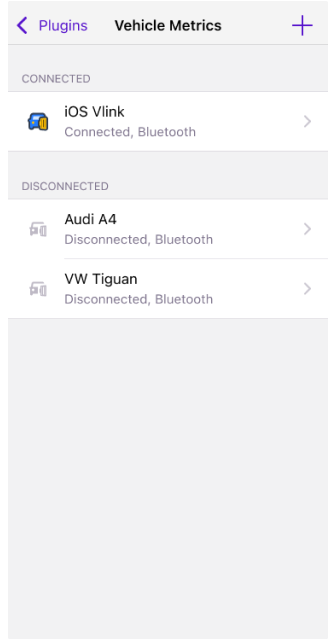 |
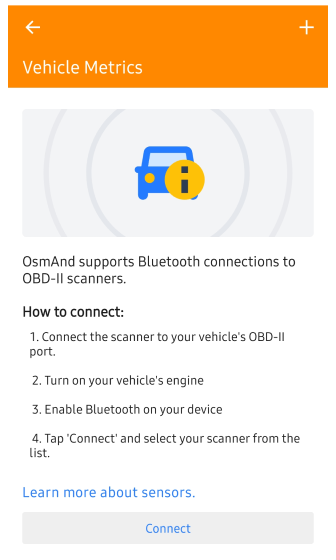
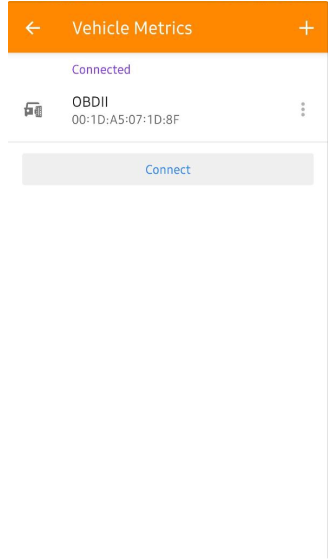
Connect the scanner to your vehicle’s port and pair it through the app:
- Navigate to Menu → Plugins → Vehicle Metrics → Settings → Connect or +.
- If Vehicle Metrics is in the Main Menu: Menu → Vehicle Metrics → Settings → Connect or +.
Choose your OBD-II device from the list and establish the connection.
Scanner Settings
- Android
- iOS
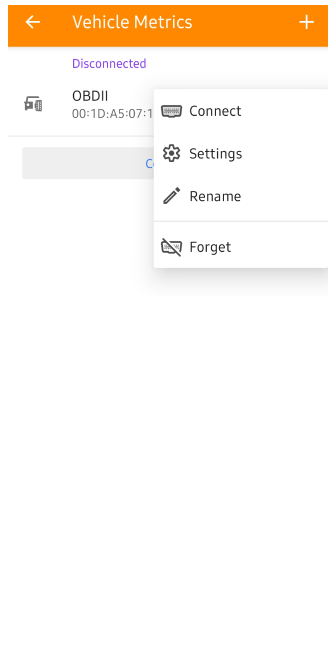
Android. Go to: Menu → Plugins → Vehicle Metrics → OBD → three-dot menu
 |  |
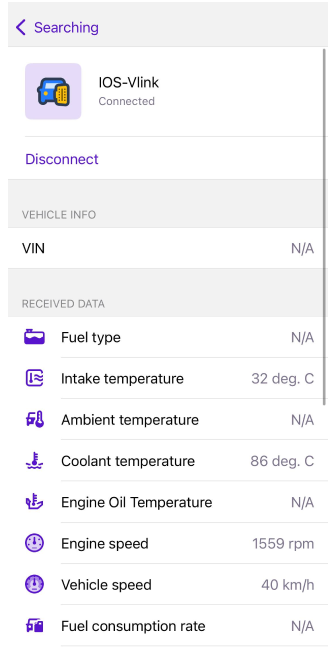
iOS. Go to: Menu → Plugins → Vehicle Metrics → OBD → three-dot menu
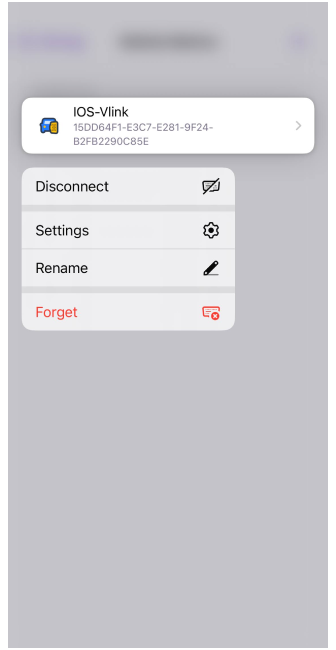 |  |
- Connect / Disconnect. Establishes or terminates the connection with the OBD-II sensor.
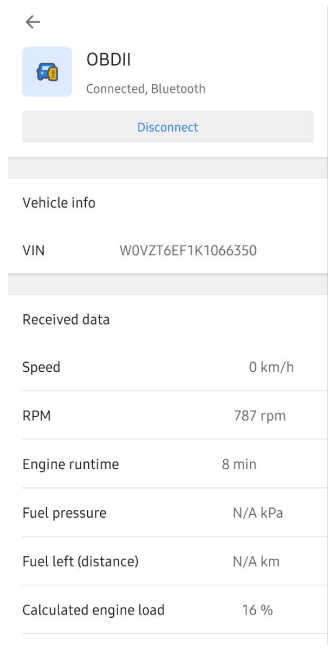
- Settings. Opens the OBD-II settings screen, allowing connection management and access to available vehicle parameters.
- Rename. Lets you assign a custom name to the sensor for easier identification.
- Forget. Removes the previously paired OBD-II sensor from the list, requiring re-pairing if needed later.
Reconnect behavior: OsmAnd automatically attempts to reconnect to the OBD-II adapter when the application is started, when navigation is started, or when Android Auto / Car Play is launched. If a connection is unavailable, Vehicle Metrics widgets display “–”. A single tap on any Vehicle Metrics widget will attempt to reconnect to the sensor. If the sensor is already connected, the tap switches widget display modes as usual.
Metrics List
Metrics are categorized for clarity. Advanced diagnostic tools enable preventive maintenance by interpreting these parameters:
Temperature:
- Intake Temperature. Displays the temperature of the air entering the intake manifold.
- Ambient Temperature. Monitors external conditions.
- Coolant Temperature. Tracks engine cooling efficiency.
- Engine Oil Temperature. Displays oil condition during operation.
Engine:
- Engine Speed. Monitors engine revolutions per minute (RPM).
- Engine Runtime. Tracks engine operation time.
- Calculated Engine Load. Indicates engine workload percentage.
Fuel:
- Fuel Pressure. Indicates the fuel system pressure.
- Fuel Consumption. Calculates the vehicle's fuel consumption.
- Remaining Fuel. Indicates the fuel level in the vehicle.
Other:
- Battery Level. Indicates the voltage level of the vehicle's battery.
- Adapter Voltage. Displays the voltage supplied to the OBD-II adapter (AT RV command).
- Vehicle Speed. Displays Vehicle Speed Sensor (VSS) data.
- Throttle Position. Determines engine air intake via throttle plate angle.
VIN. Displays the vehicle's 17-character identification number.
Trip Recording
- Android
- iOS
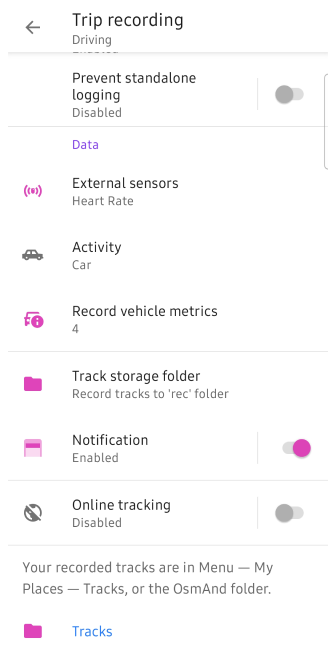
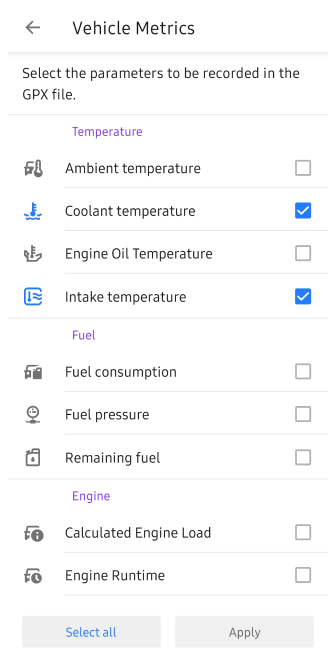
Android. Go to: Menu → Plugins ��→ Trip recording → Settings → Data → Record vehicle metrics
 |  |
iOS. Go to: Menu → Plugins → Trip recording → Settings → Data → Vehicle Metrics
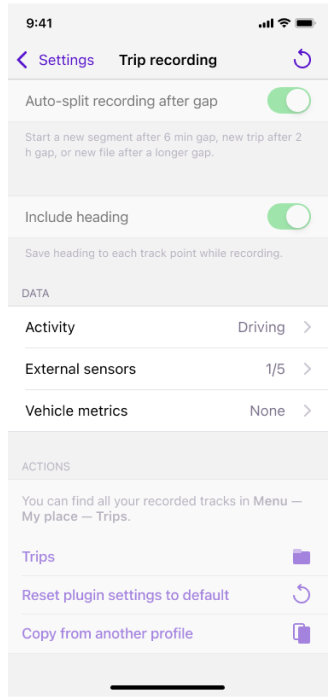 | 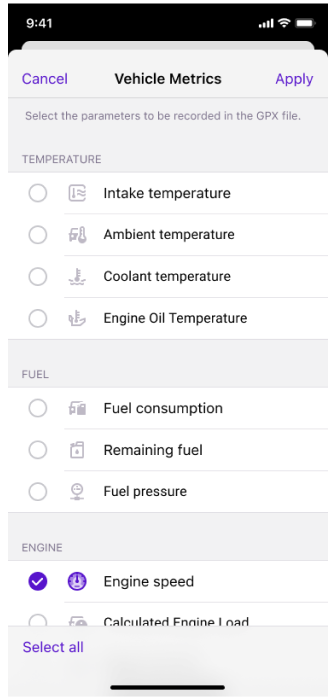 |
To include OBD-II data in a GPX file, you need to select the desired parameters for recording using the Trip recording plugin. This allows you to analyze vehicle metrics alongside your trip data.
Tags
OsmAnd applies custom tag names for vehicle metrics in the GPX file. For example:
vm_eotemp: Engine Oil Temperature.vm_fpress: Fuel Pressure.vm_espeed: Engine Speed.
These tags make it easier to identify and utilize specific vehicle data when reviewing the recorded GPX file.
Widgets
- Android
- iOS
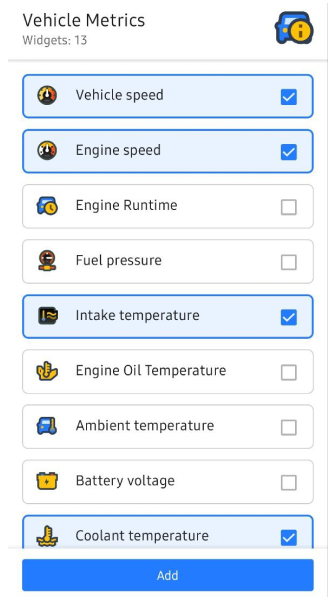
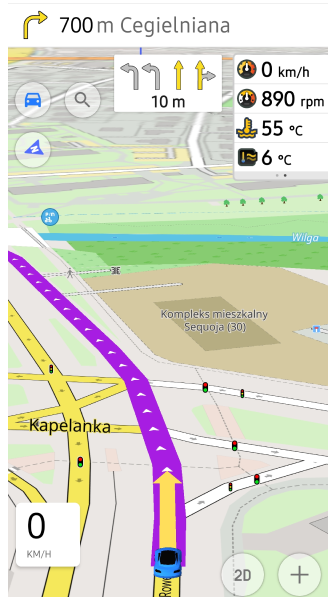
Android. Go to: Menu → Configure screen → Widgets → Choose a panel → Vehicle Metrics
 |  |
iOS. Go to: Menu → Configure screen → Widgets → Choose a panel → Vehicle Metrics
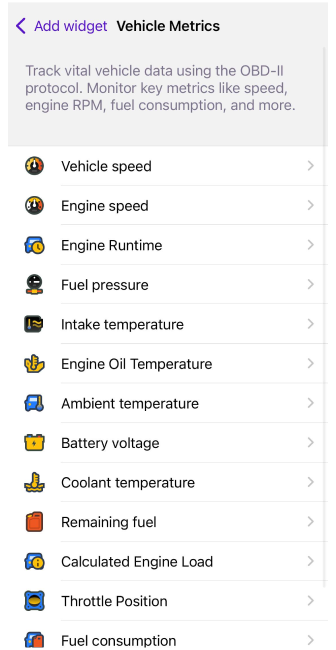 | 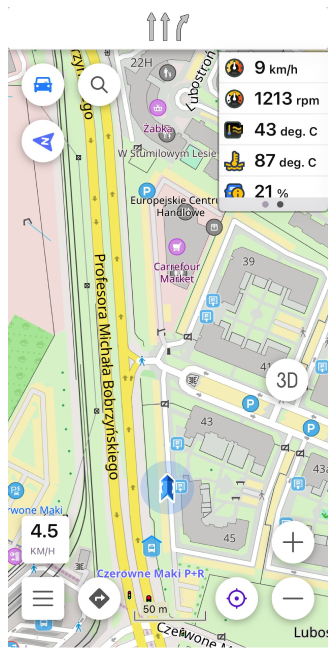 |
The Vehicle Metrics widgets are automatically included when you enable the plugin. If they do not visible, you can manually add them via the Configure Screen menu.
Widget Settings
The widgets display key data from your connected OBD-II device in real time, such as speed, engine metrics, and fuel consumption. Ensure they are visible before starting your trip to track metrics seamlessly.
Some widgets offer display mode options:
- Instant. Displays real-time data for the selected metric.
- Average. Displays averaged values over a configurable time interval (15 seconds to 60 minutes).
Several widgets, including Fuel consumption, adapt their displayed units and regional metric formats based on the Profile Settings. When using volume units other than liters, Fuel consumption supports showing values as Miles per Gallon (MPG). The exact MPG type depends on the selected volume unit:
- US gallons → MPG (US)
- Imperial gallons → MPG (UK)
The widget automatically selects the appropriate format according to the chosen Length and Volume units in the active profile, and your chosen display mode is preserved when exporting and importing profiles.